
Built by agroforestry professionals, Overyield is the most comprehensive farm-scale tree crop planning tool available for landowners, developers, farm planners and investors.

Overyield • Agroforestry Planning Software

Celebrating 2,500+ farm plans created by Overyield users. That’s 500,000+ acres of tree planting projects across 4 continents.

Farm planners use Overyield for:

Agroforestry Reforestation Orchards Silvopasture Alleycropping Vineyards Windbreaks


Dig into the Features

Go from using 5+ tools to using a single app for farm-scale tree planting plans.

Geospatial Mapping Tools

Layout & Design Tools

Economic Planning Tools

Maps & Soils

Better Base Maps

Access 3 different satellite base maps to gain a diverse look at your farm. Often satellite maps aren’t current or clear. Switching between NAIP, Mapbox and Bing maps enables a clearer look at your farm.

Satellite map of a landscaped outdoor area with contour lines, roads, trees, and a building, showing a designated zone outlined in orange.

Simplified Soil Maps

Get the best available user experience for soil maps for U.S users. Get comprehensive access to soil typologies and their underlying attributes.
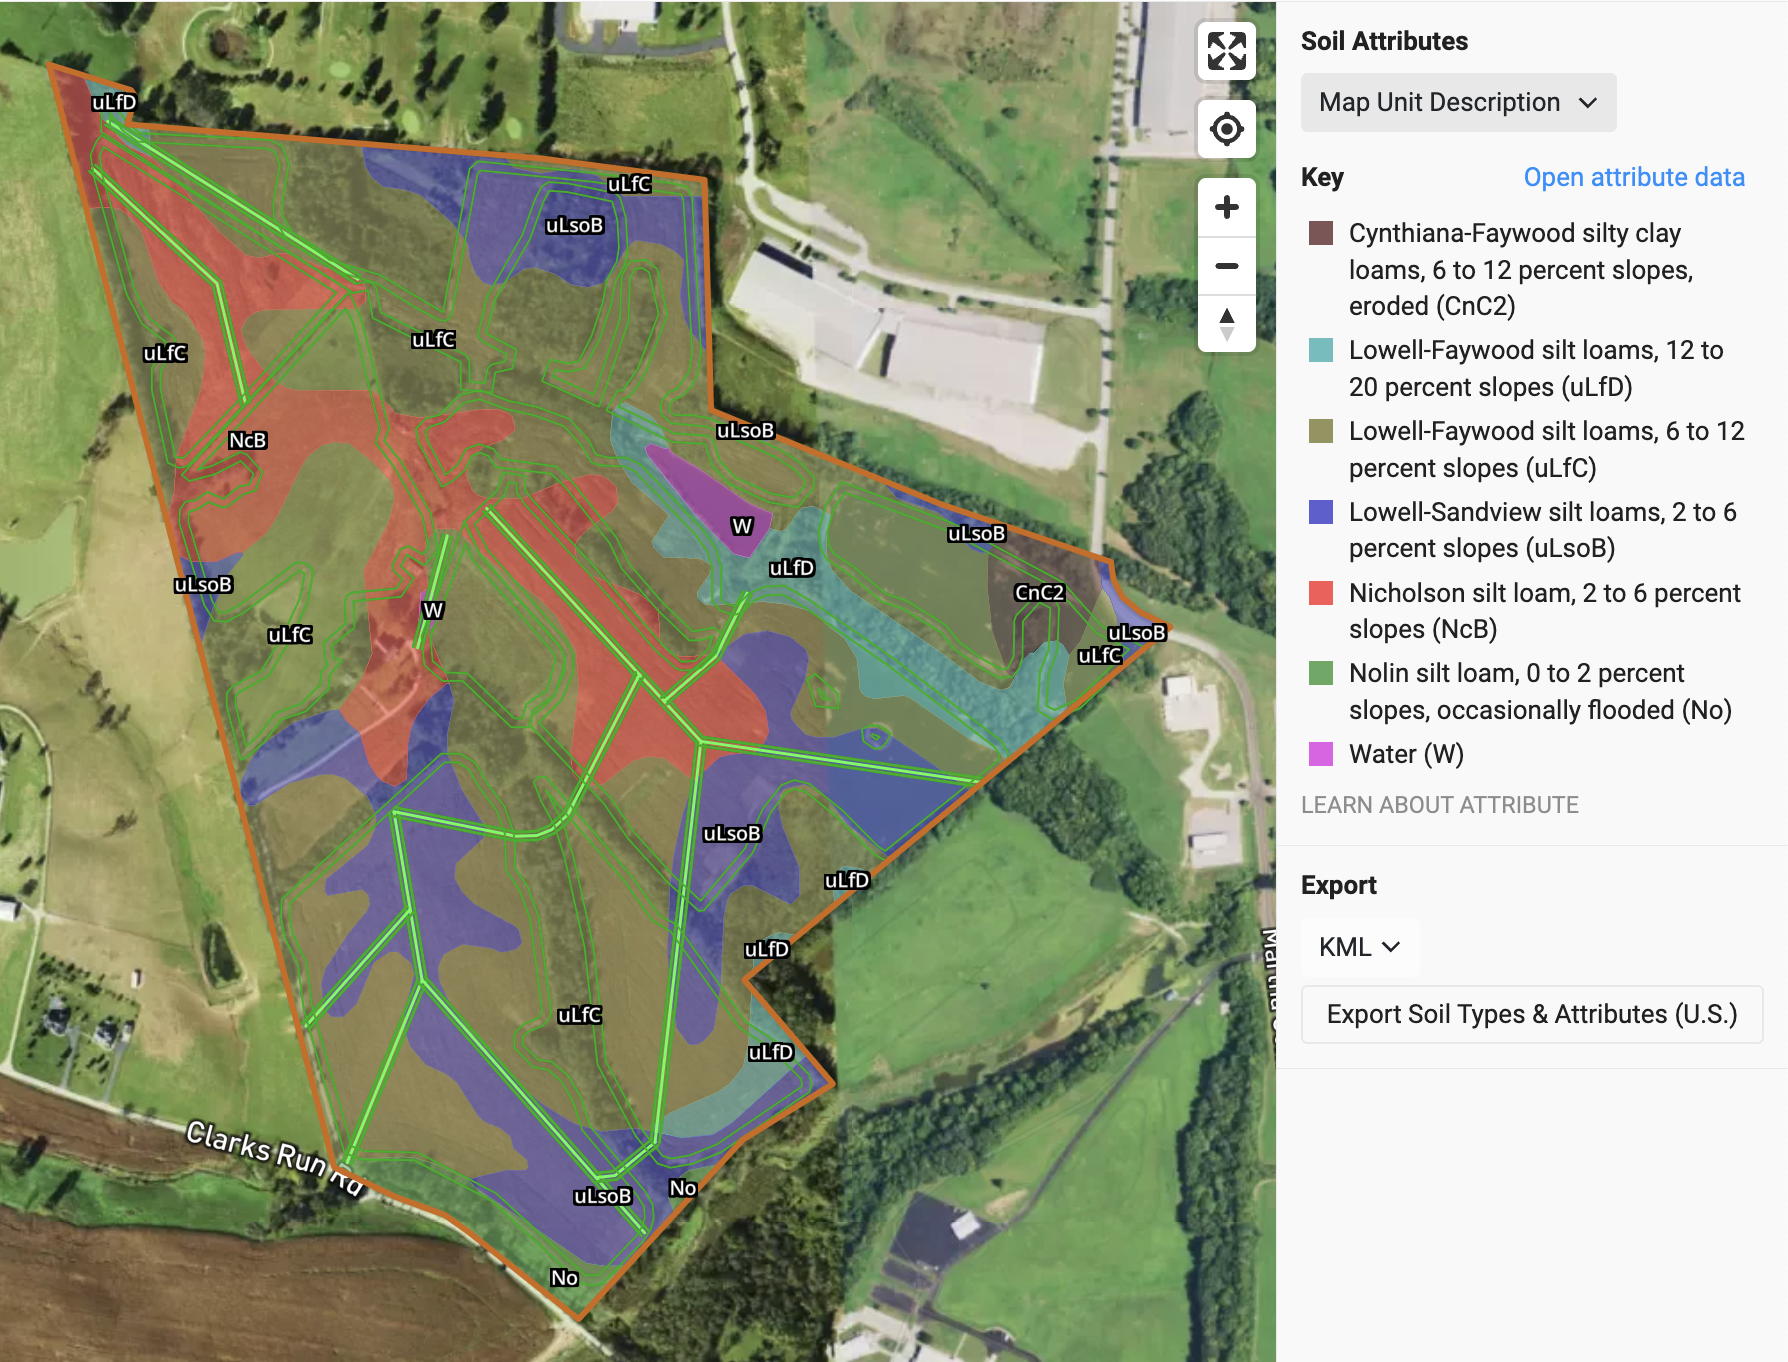
Aerial map of soil attributes in a designated area, showing different soil types with color codes and labels such as uLFC, uLsoB, and NiCB, along with water zones marked in purple. The map includes a legend explaining soil types and slopes, and an orange border outlining the area.

Detailed Soil Attributes

Dig into 40 unique soil attributes at different soil depths to understand the nuances of your projects soils.
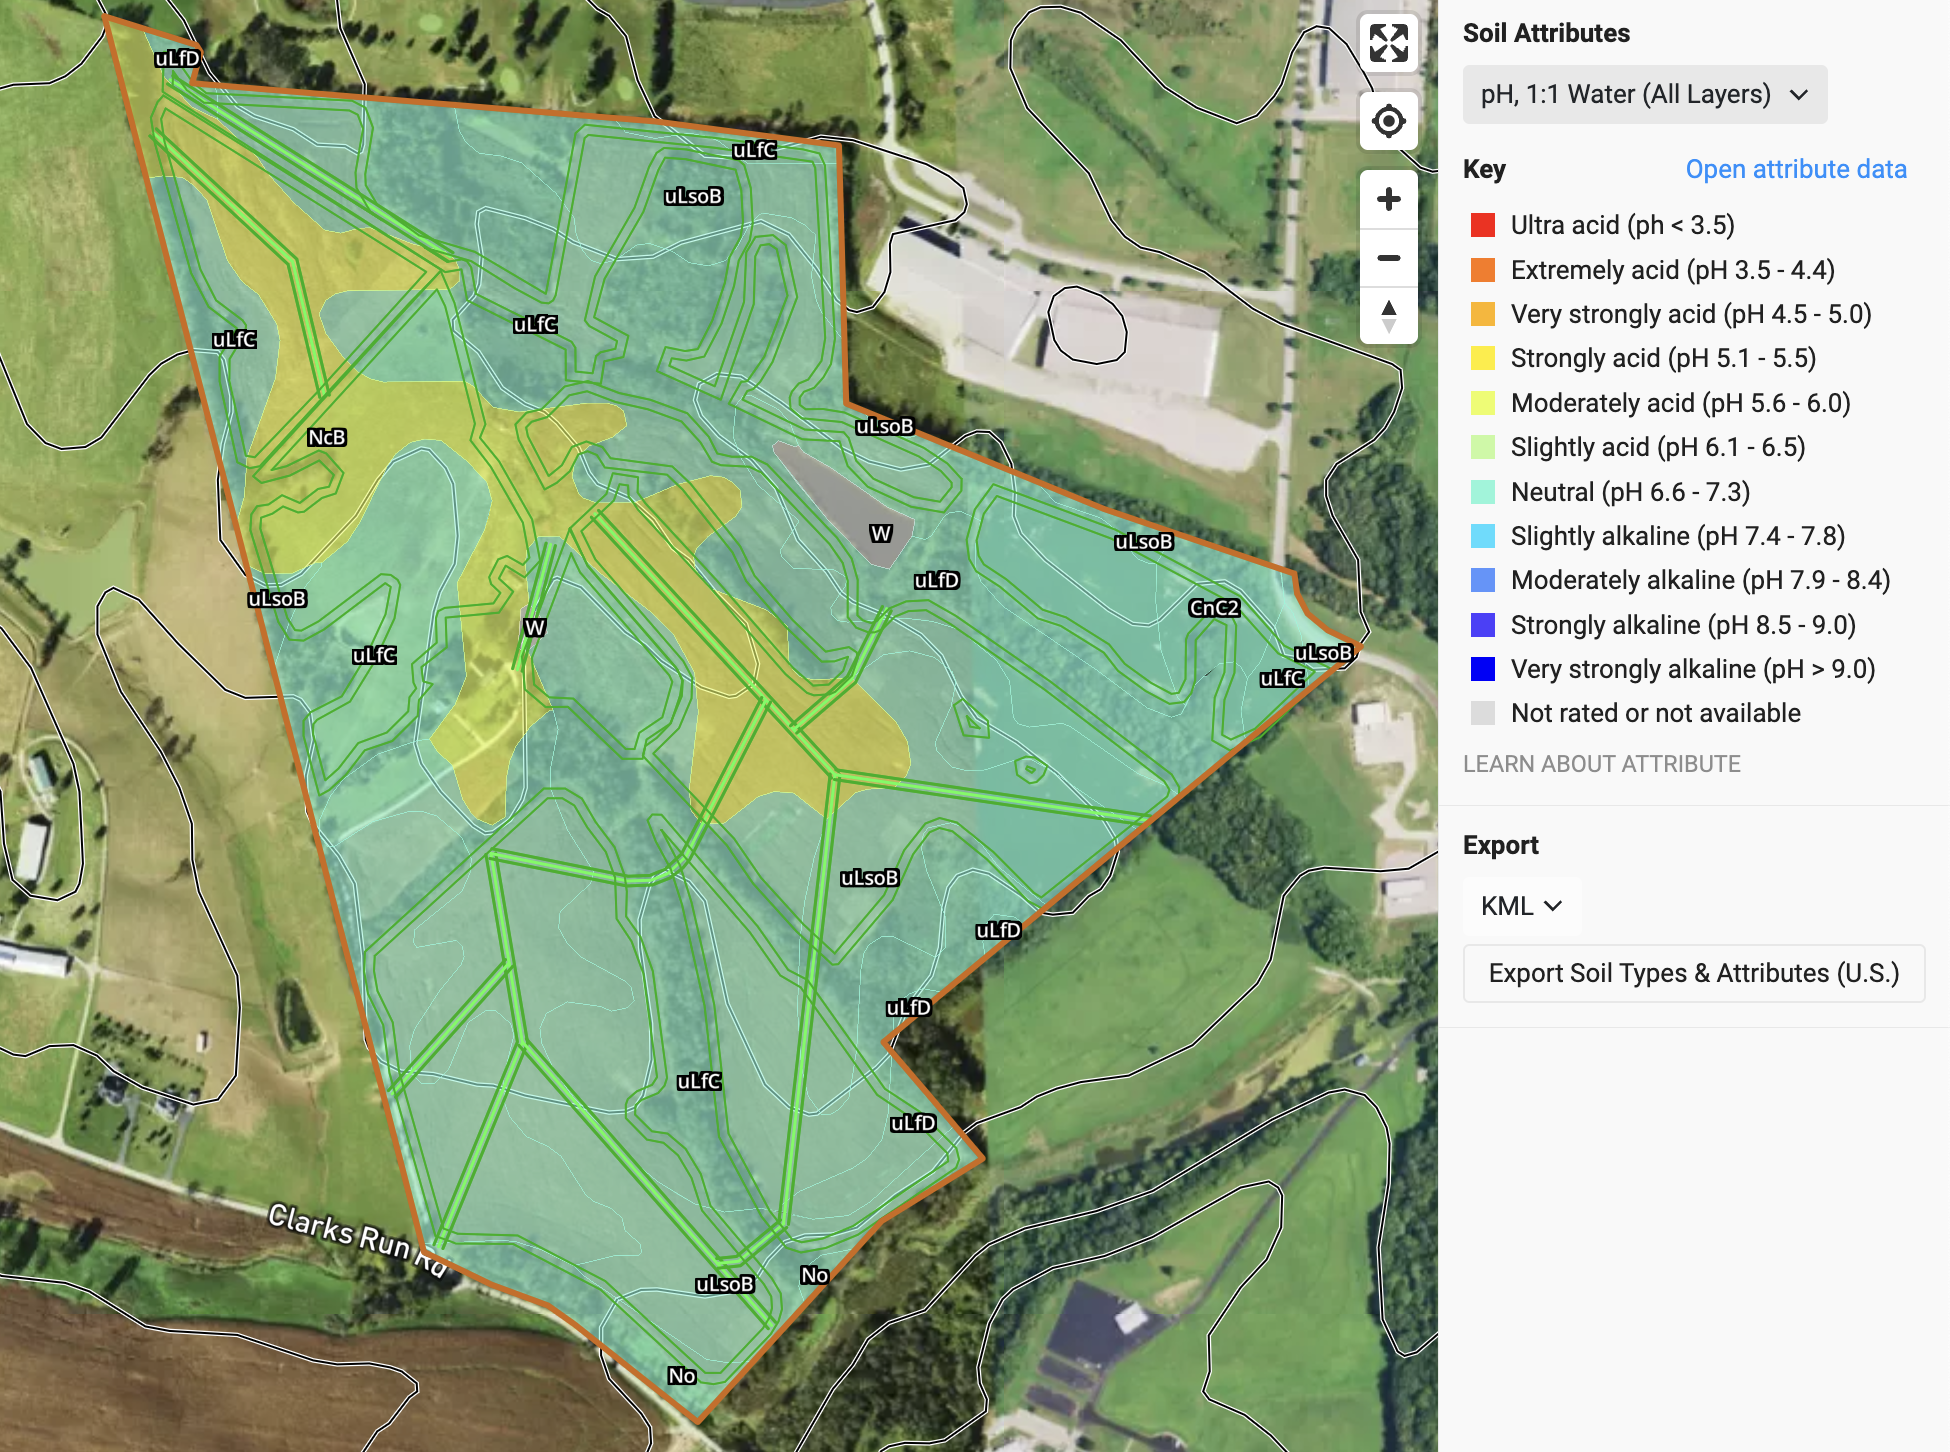
A map showing soil acidity levels in a specific area, with color-coded zones indicating different pH levels from ultra acid to very strongly alkaline. Contour lines demarcate various regions, and the map is overlaid on an aerial view of the land, including roads and buildings.

Suitability & Productivity

Land Use History

Take a look back in time at how farms we’re managed with land use history maps.

A satellite land use map with color-coded regions indicating different types of crops and land covers, overlaid on a background of fields, buildings, and roads in an agricultural or rural area.

Site & Tree Productivity

Look at cropland and forestland productivity using NAIP and Site Index. Dig into the details of around productive and get info on recorded species for site soils.

A map showing forestland productivity and site index attributes in Mason County, Kentucky, with contour lines and color-coded site index levels ranging from 70 to 120 feet.

Only available in the U.S.A

Crop Suitability

Get a sense of how suitable your land is for over 15 tree and shrub species in the U.S.
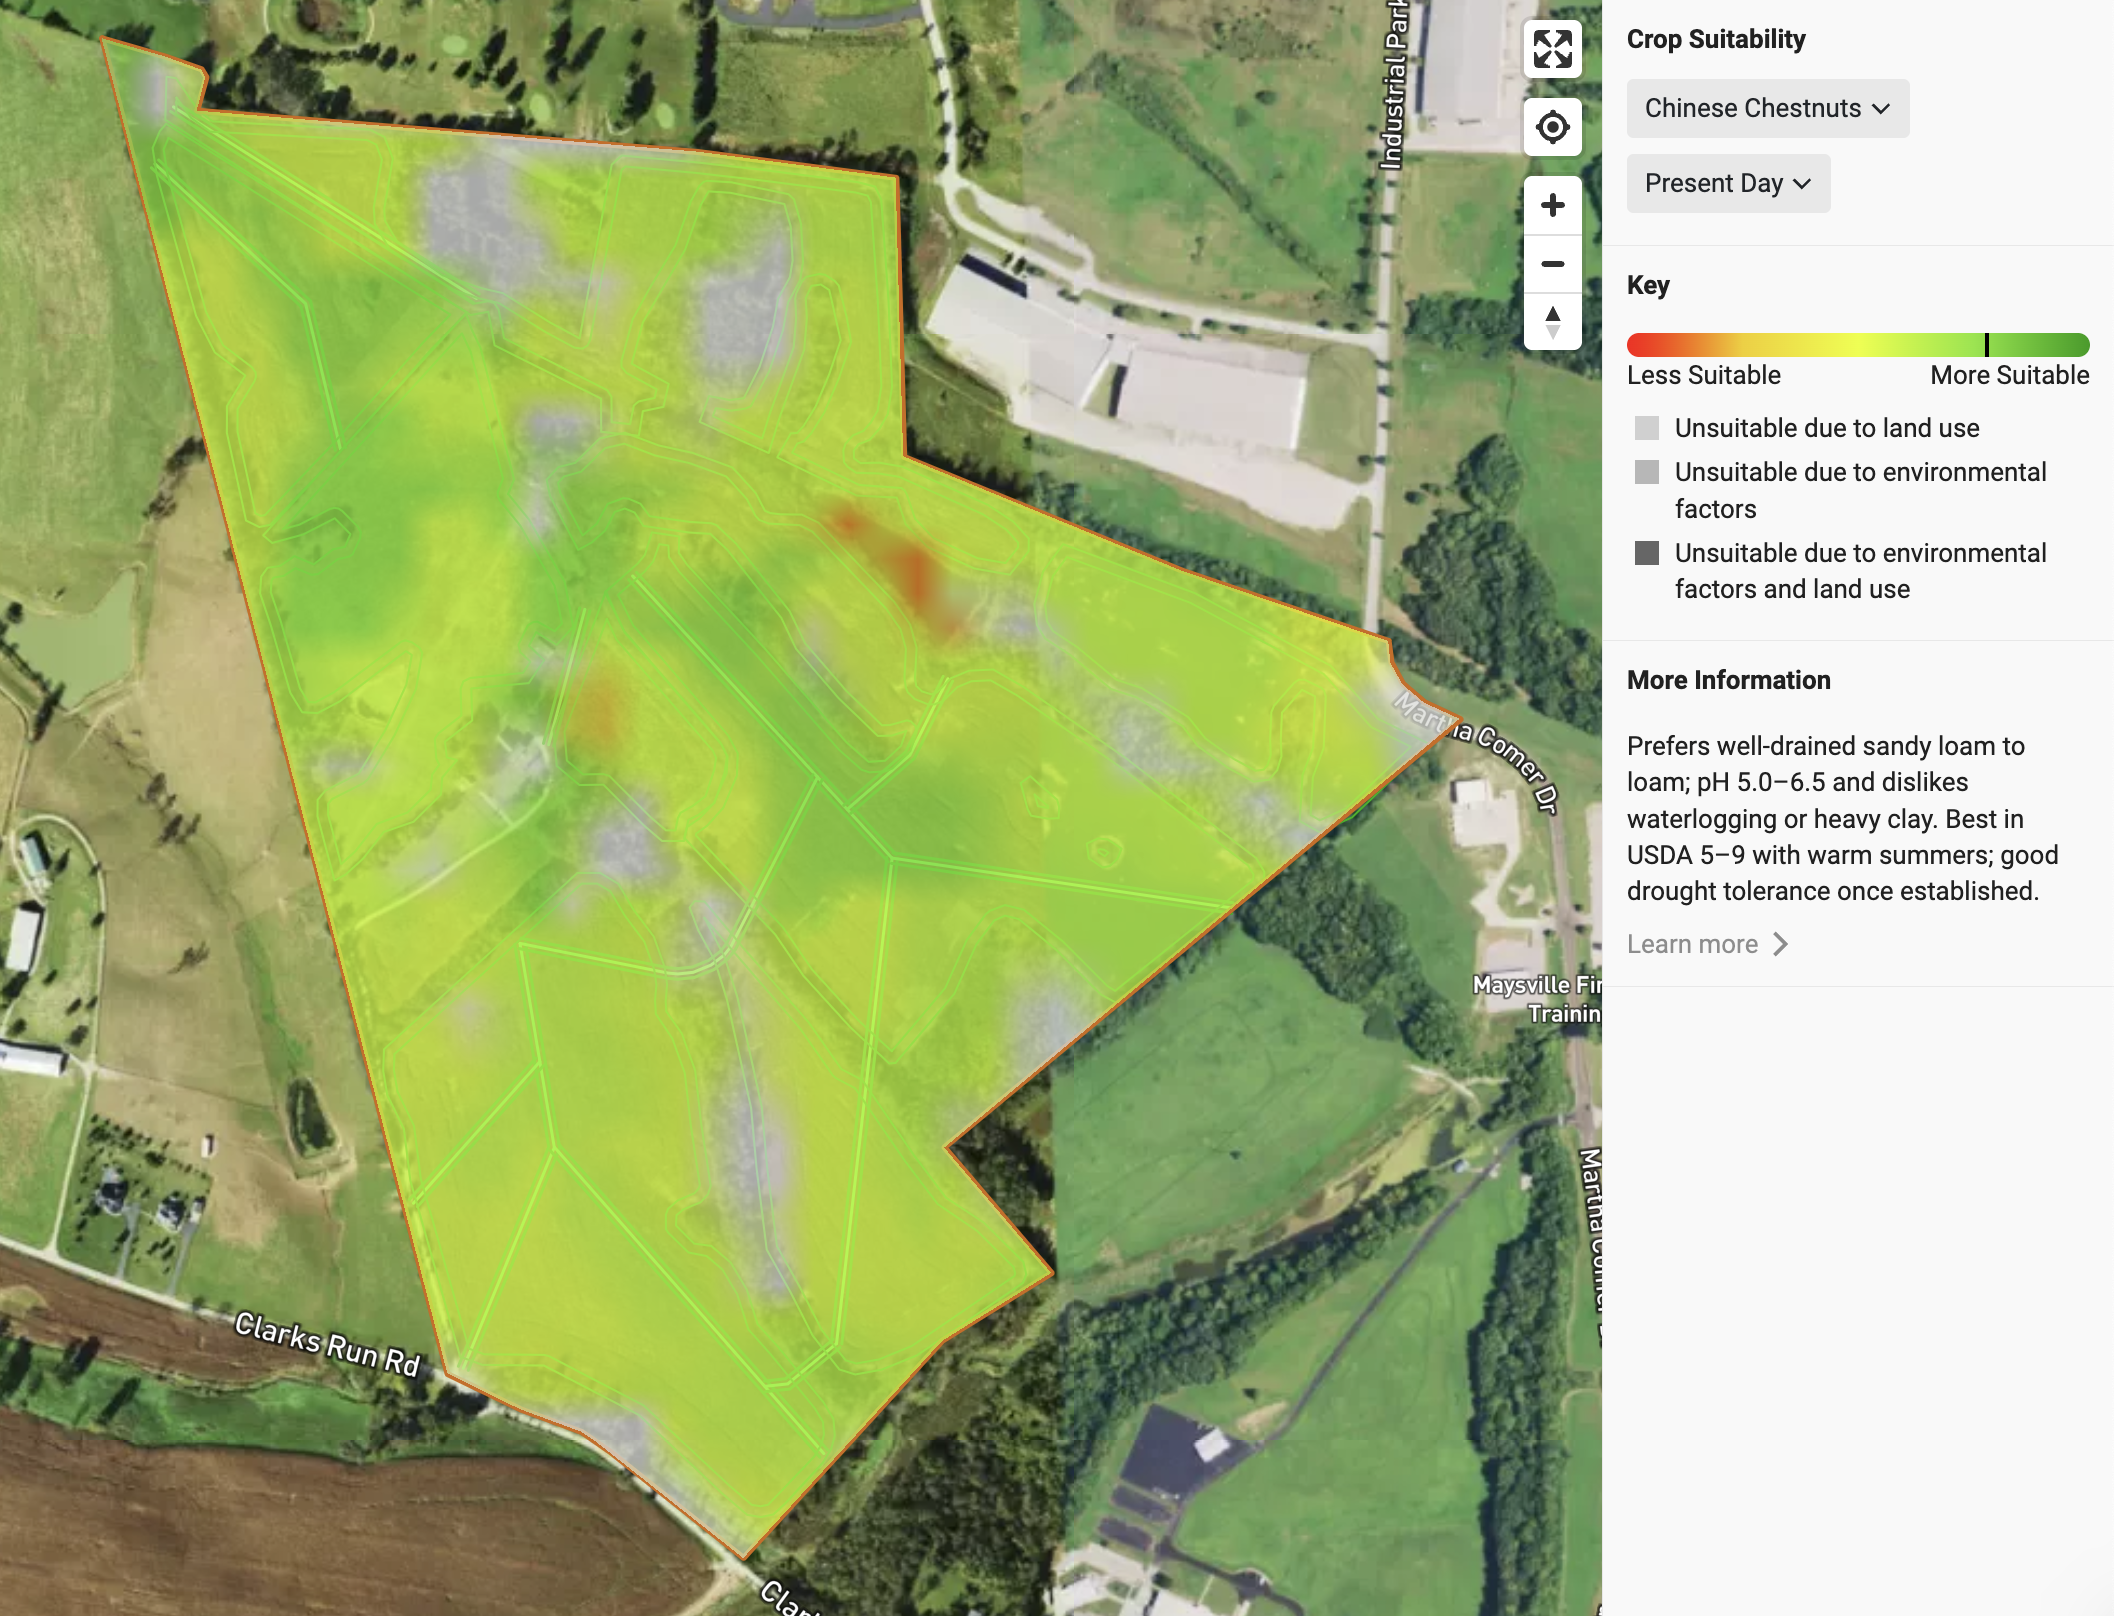
Aerial view of a geographic area with a color-coded overlay indicating crop suitability for Chinese Chestnuts, ranging from less suitable in red to more suitable in green. The area is outlined in orange and shows land features including roads and buildings.

Layout Tools

Layout & Drafting Layers

Use a variety of pre-built layers or create your own custom layer to draft areas and field shapes. Create roads, piping, headlands, and more.

Aerial map showing terrain, with colored lines indicating roads, headlands, ridges, valleys, and farm boundaries, overlaid on a landscape of grass, trees, and soil.

Auto-generated spacings

Section tools dynamically generate row and point grids as you end. Get automatic outputs as you select crops, rotate the rows, and change spacings.
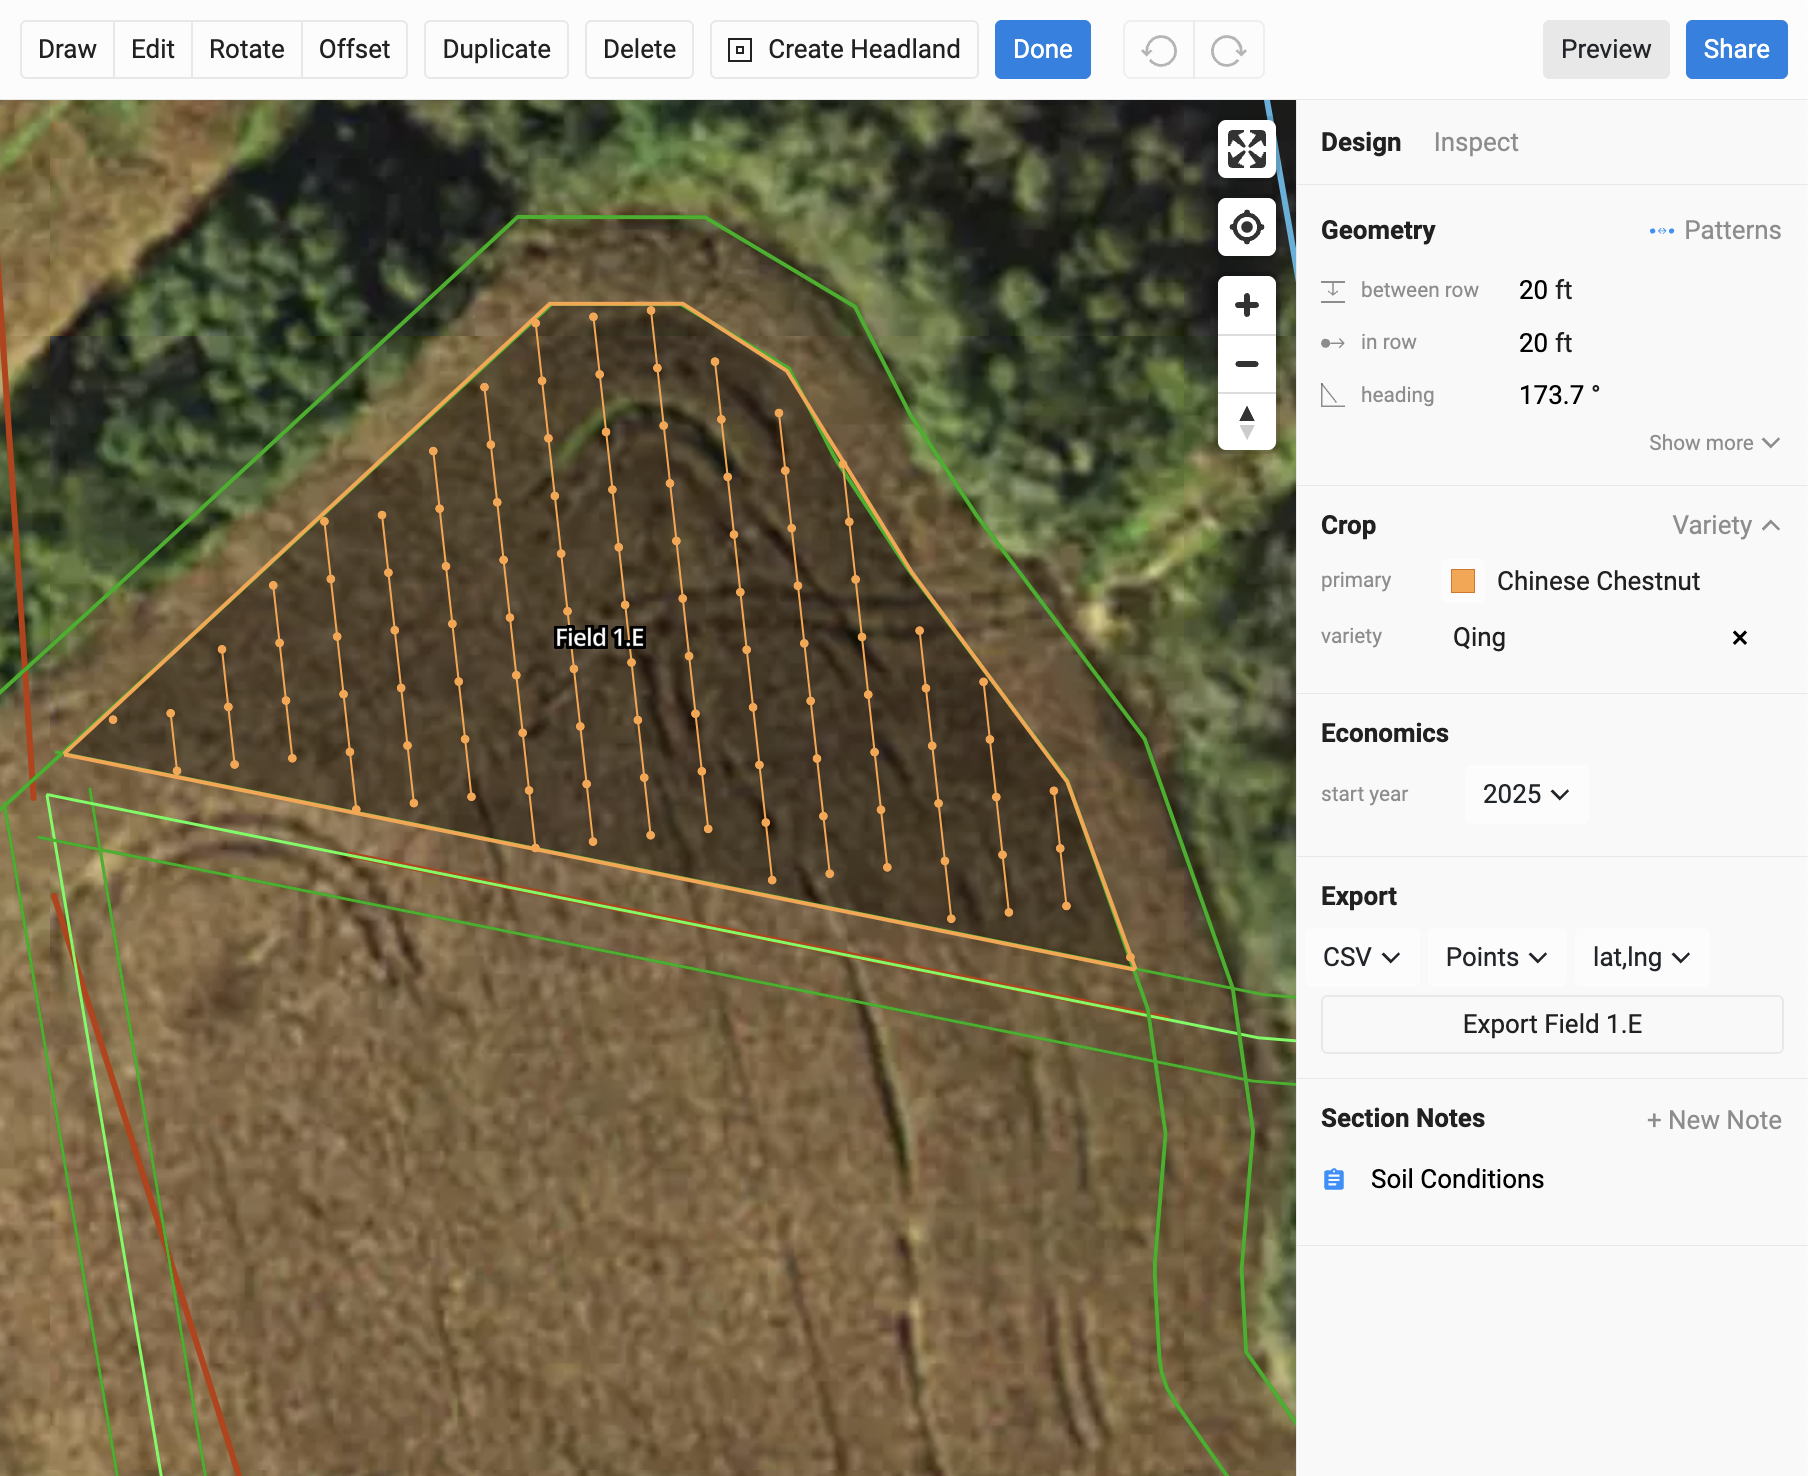
An aerial view of a farm field with a soil plot outlined in orange and a larger surrounding area outlined in green. The soil plot is planted with Chinese chestnut trees of the Qing variety, indicated as 'Field 1.E'. The background shows a grassy area and some trees.

Grids, Lines, and Keylines

Multiple section tools enable you to plan fields with curves or single rows on fields edges.

Aerial map of a field with contour lines and color-coded boundaries over a dirt and grassy area.

Patterning & Export

Multi-Species Patterns

Great for diverse plantings and system types. Build highly diverse in-row species mixes and use non-standard spacings.

A map showing crop rows in a field, with different colored lines outlining planting areas and points marking specific locations, and a sidebar listing rows and sections of the field.

Row Level Crop Selection

Start adding diversity to your plan. Edit sections down to the row level. Add multiple species and label crop varieties within a field.

Aerial view of a garden or farm plot with marked plots for Chinese Chestnut and Biodiversity Mix crops, surrounded by green foliage and trees.

Automated Measurements

Get tree, row, and acre counts automatically as you edit sections. Cut data across field and rows, and ensure you have accurate measurements for all your on the ground activities.

Aerial map of a farm with soil sampling zones for Chinese Chestnut and White Pine trees. The map shows numbered rows, field boundaries, and labels for tree species and crop areas.

Geospatial and Tabular Exports

Export your farm plan in formats that work for any on-farm device, from tractors to hand GPS systems. Go from your digital twin to on the ground spec quickly.

A dropdown menu showing export options including CSV, JSON, KML, PDF, and SHP.

Economic Planning Tools

Economic Summary

Graph showing 30-year financial summary with gross income, cumulative gross income, internal rate of return at 15.25%, net present value of approximately $2.4 million, and total genetics and install cost of around $272,000.

Dynamic, Long Term Modeling

Project 30 year long economic models that dynamically change as you edit your field plans. .

Data Snapshots

Get data snapshots that showcase the high level costs for key categories across the life of the project from operations, to revenue, to genetic stock.

A financial chart showing installation costs with categories: Developer Services, Materials, Rental or Contracted Services, Labor, Fuel, and Depreciation, totaling $214,959.

Exportable Income Statements

Export detailed income statements and underlying data that enable you to pull outputs into excel for further analysis and presentation.
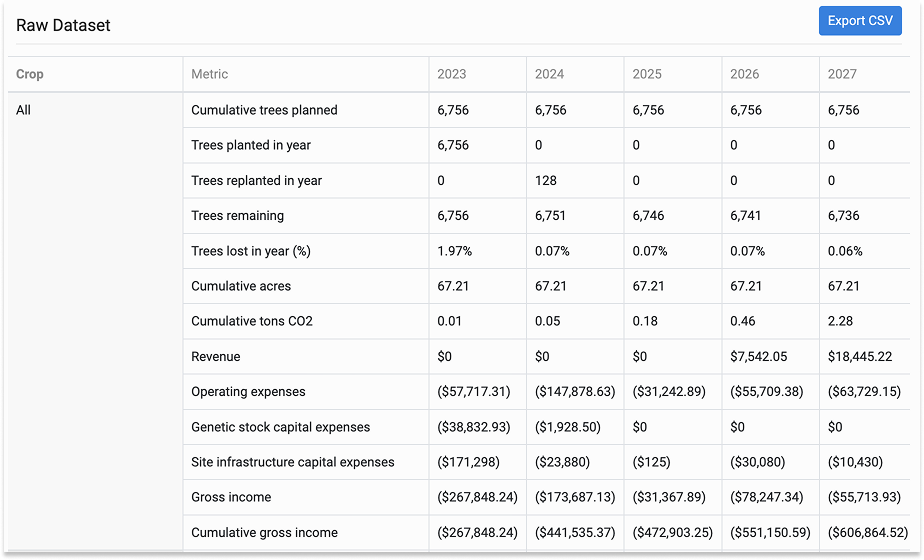
Spreadsheet titled 'Raw Dataset' showing data from 2023 to 2027 on trees planted, trees remaining, trees lost, cumulative acres and tons CO2, financial revenue, expenses, and gross income.

Crop Operations

Detailed Operational Plans

View detailed operational budgets for different crops. Project those plans over 30 years to ensure you understand the annual cost of operations for you farm plan.

A line graph showing operation expenses over 30 years for different crop types, with colors representing each crop. The graph includes a legend with total expenses and average costs for each crop, including All Crops, Bitternut Hickory, Chestnut, Biodiversity, and Mixed Berries.

Customizable Inputs

Create and customize all data for operations and pull in inputs and equipment to ensure you are as detailed or generic as you’d like to model. Model in a variety of units, from per tree to per acre.

A social media or data entry form labeled 'Apply Fertilizer' with fields for assignment, operation type, category, group, laborers, equipment, inputs, and timing. The form includes dropdown menus, text fields, and buttons for adding and saving information.
Pie chart illustrating various full production areas for the year 2030, including Spray Materials Placeholder, Other, Micropak, Azomite, Sales Containers, Diesel, Woodchips, Compost, Kelp (dry), Sap Analysis, and Pest Traps & Materials.

Templates for Ease of Use

Create crop templates for your team so crop models can be used across multiple farms.


Revenue & Yield
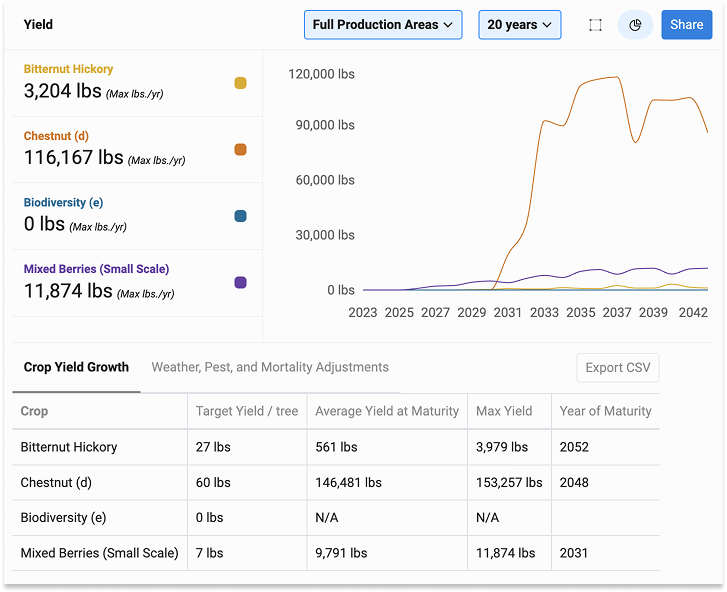
Line graph comparing crop yields over 20 years for different berries and trees, showing significant increase in chestnut (d) yield and moderate growth in mixed berries, with no biodiversity yield recorded.

Forecast Yield & Losses

Forecast production based on crop by crop yield curves. Adjust yield based on predictions for crop losses and tree losses.

Forecast Revenue

Forecast future revenue based for your farm plan based on crop pricing for your target market.
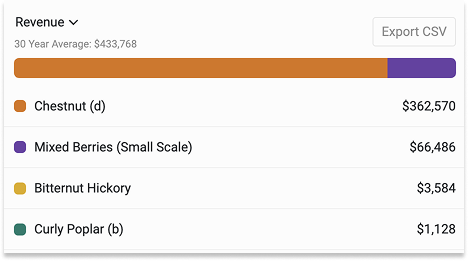
Bar chart showing 30-year average revenue with four categories: Chestnut (brown, $362,570), Mixed Berries (small scale, purple, $66,486), Bitternut Hickory (orange, $3,584), Curly Poplar (blue, $1,128).
A table titled 'Revenue Breakdown' showing different crops, revenue streams, percentage yields, and prices. Crops include Bitternut Hickory, Chestnut, Mixed Berries, and options to pick.

Value-Add Channels for Crops

Edit crop pricing and allocate crop yield across sales channels. Model value-added channels using unit conversions from raw yield into different end-products.

Stylized logo with geometric shapes in green, orange, yellow, and black, accompanied by text 'By Propagate' in black.

Put the Right Tree, in the Right Place for the Right Reason

De-risk your projects from species selection to planting.

A tall tree in the middle of a field of green crops under a cloudy sky.
A wide view of a farm field with rows of young trees supported by black posts, surrounded by wildflowers and grass, under a cloudy sky.
A black calf standing in a grassy field among tall trees, with brown and red calves in the background.
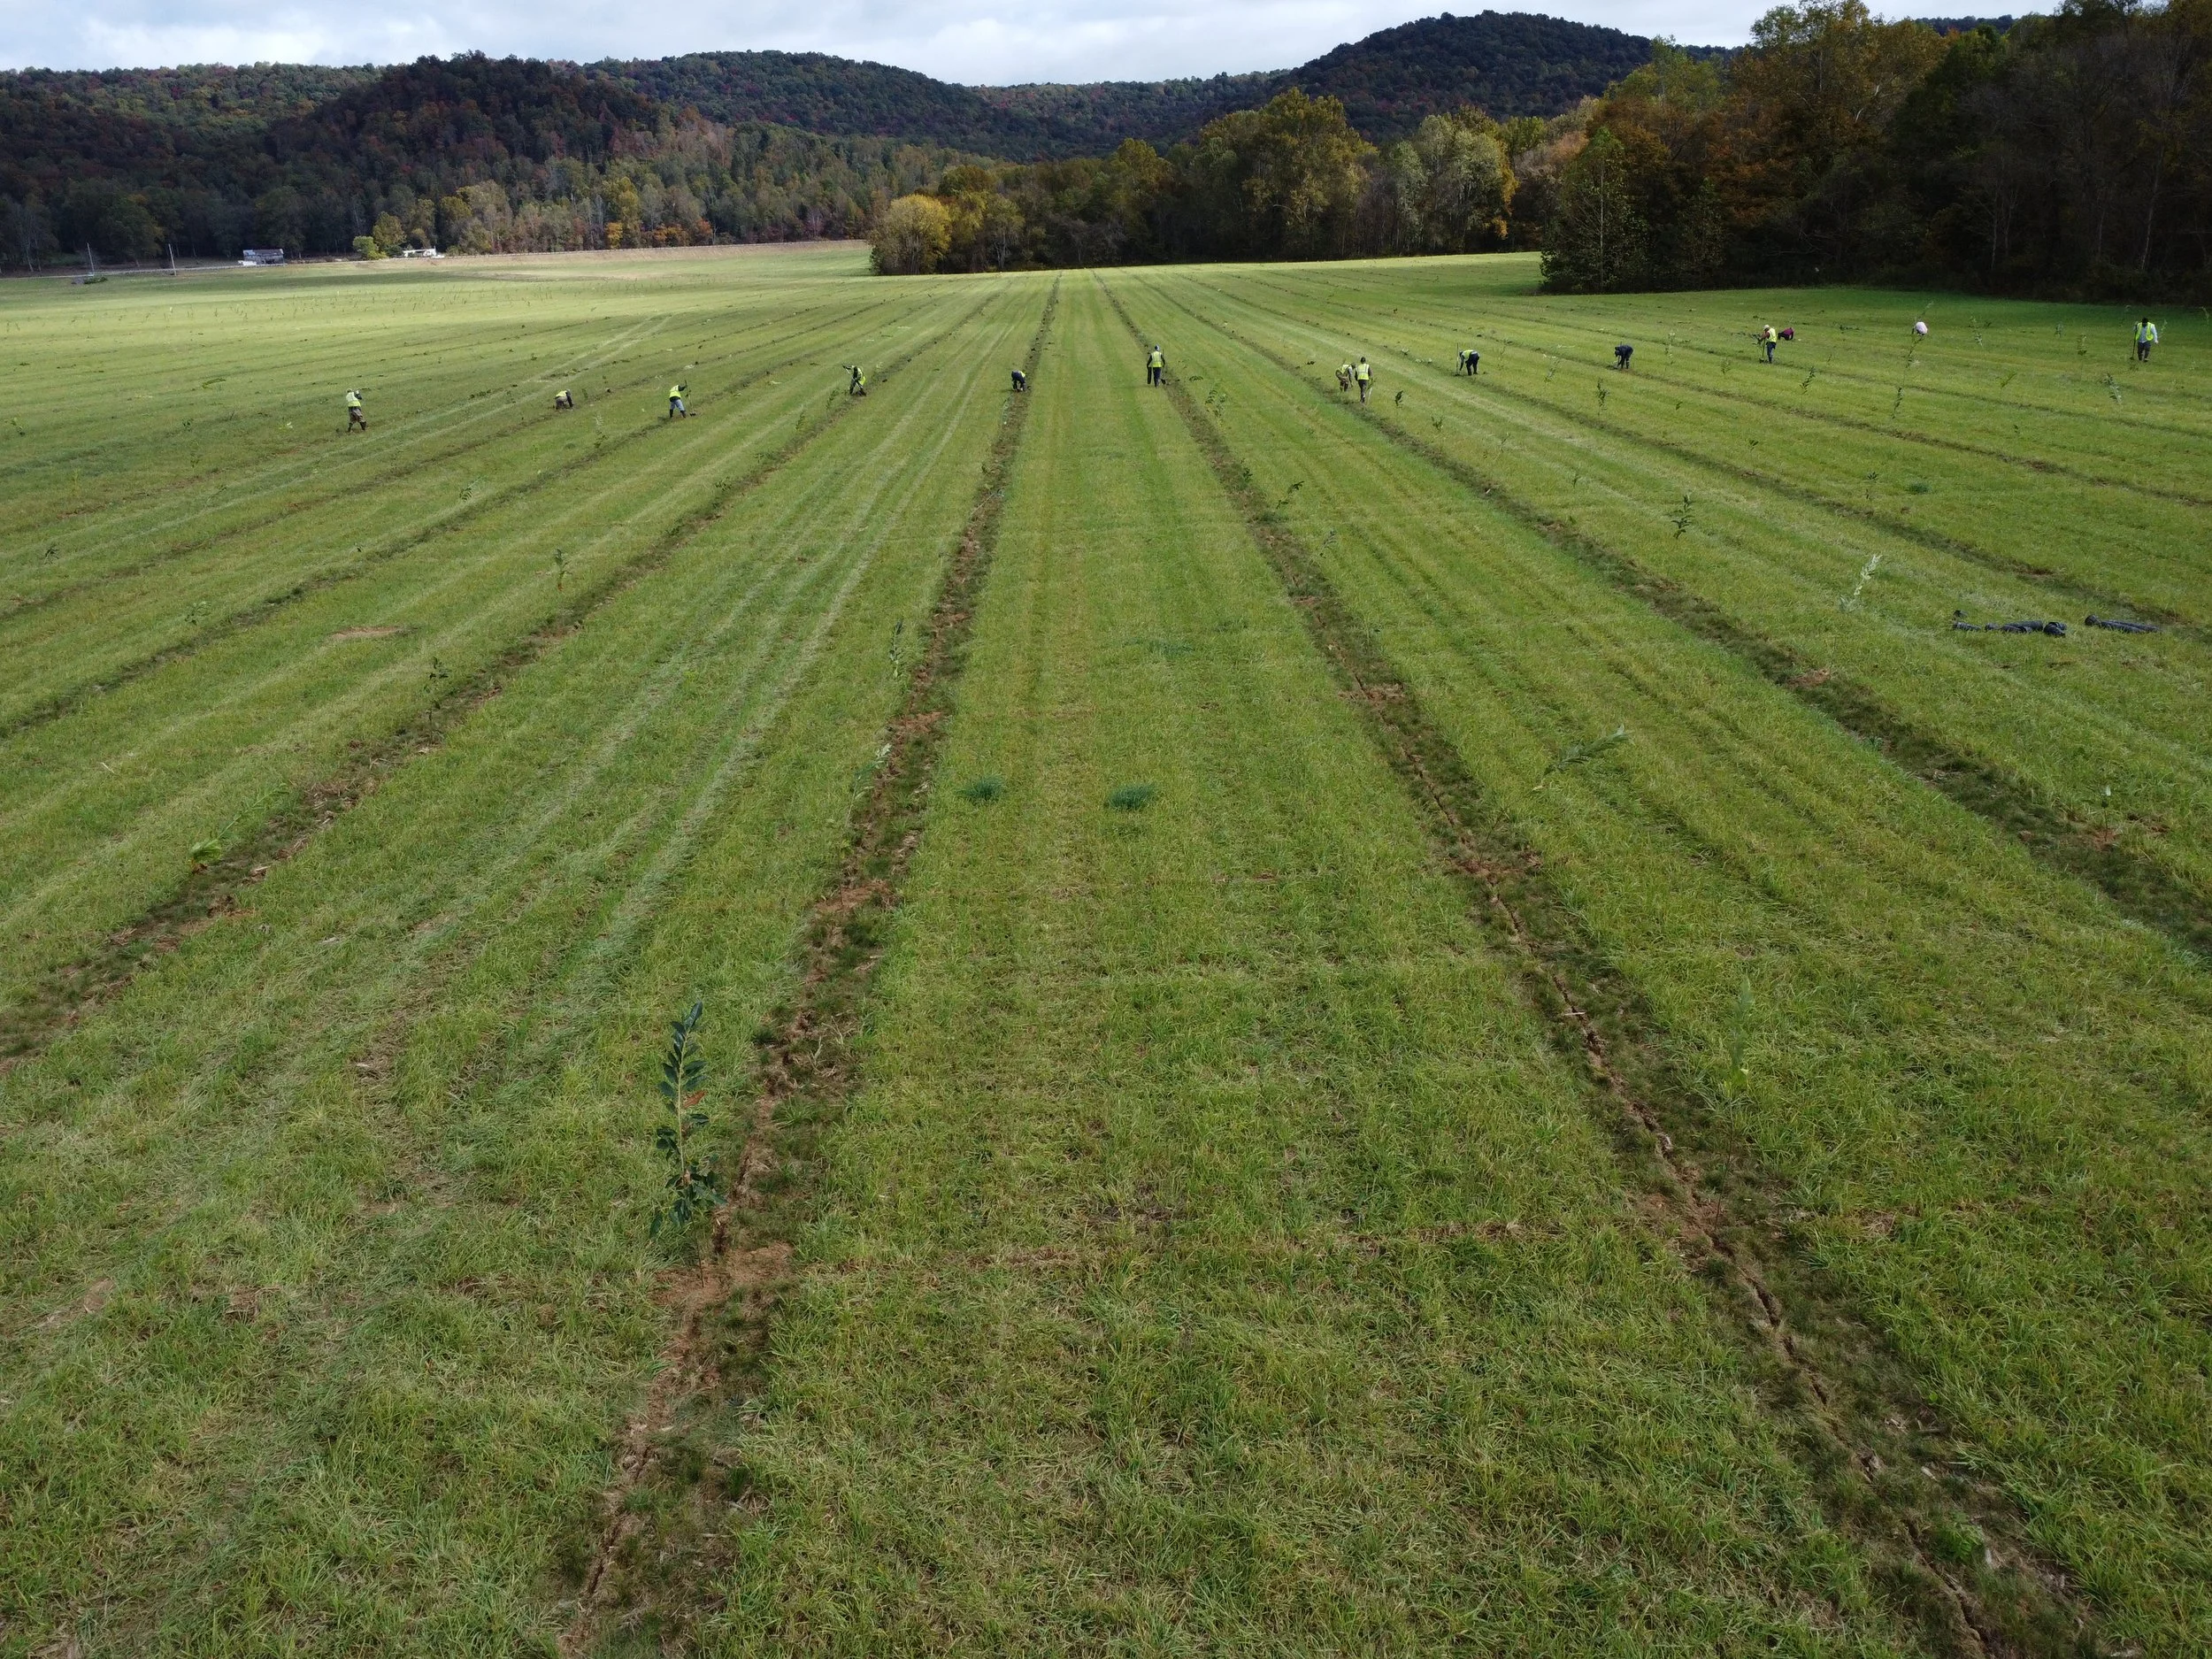
A rural area with young trees planted in rows, supported by white protective tubes, under a clear blue sky with scattered clouds, surrounded by green grass and bushes.